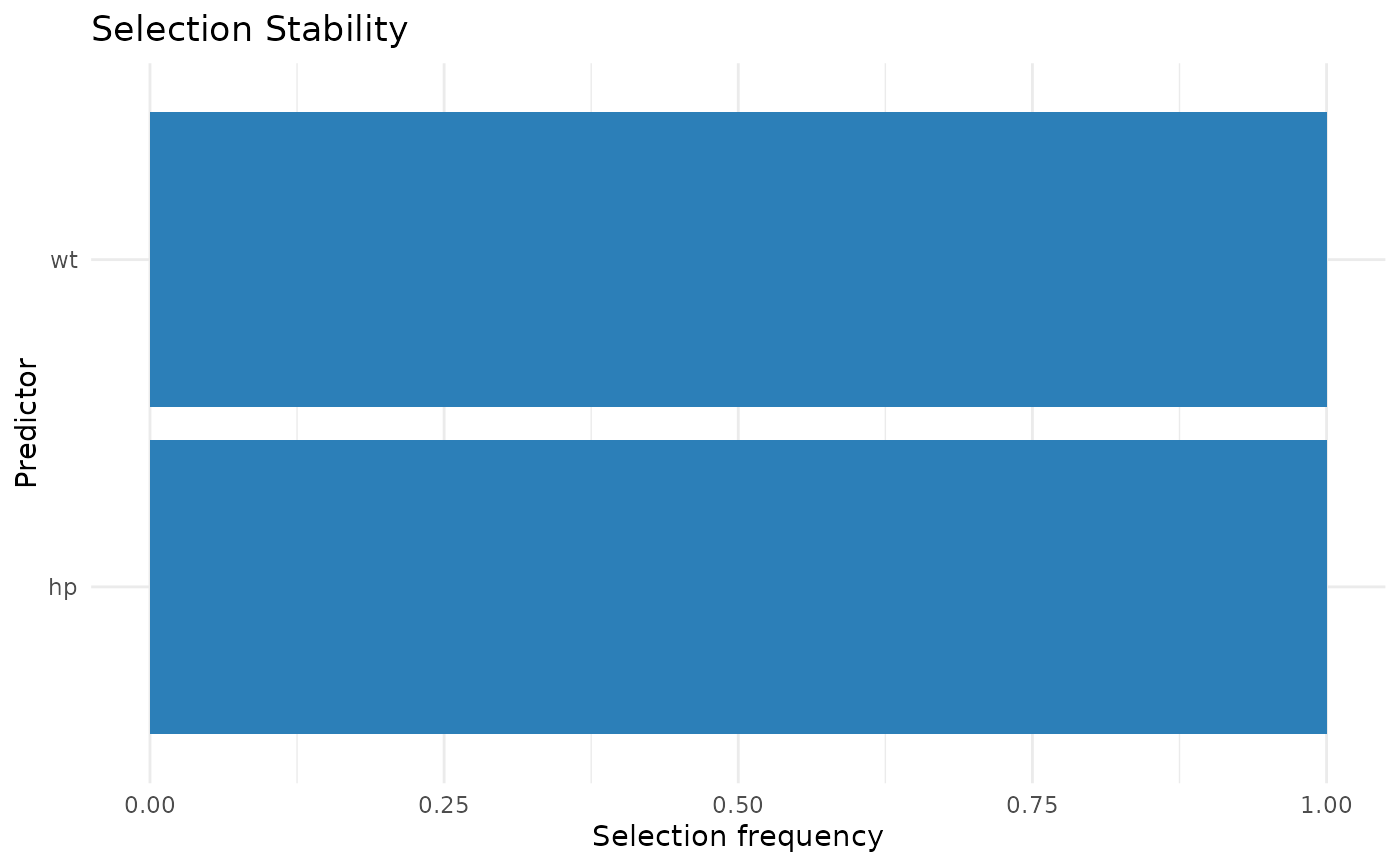
Produces a ggplot2 bar chart for either the coefficient variance or the selection frequency of each predictor term, ordered from lowest to highest value.
Usage
plot_stability_gg(diag_obj, type = c("coefficient", "selection"))Arguments
- diag_obj
A
"reprostat"object returned byrun_diagnostics.- type
One of
"coefficient"(default) or"selection".
Examples
# \donttest{
if (requireNamespace("ggplot2", quietly = TRUE)) {
  d <- run_diagnostics(mpg ~ wt + hp, mtcars, B = 50)
  plot_stability_gg(d, "coefficient")
  plot_stability_gg(d, "selection")
}

# }
# }