Produces a bar chart or histogram summarising one stability dimension from a
reprostat object.
Usage
plot_stability(
  diag_obj,
  type = c("coefficient", "pvalue", "selection", "prediction")
)
Arguments
- diag_obj
A
reprostatobject fromrun_diagnostics.- type
Character string specifying the plot type. One of
"coefficient"(default),"pvalue","selection", or"prediction".
Examples
set.seed(1)
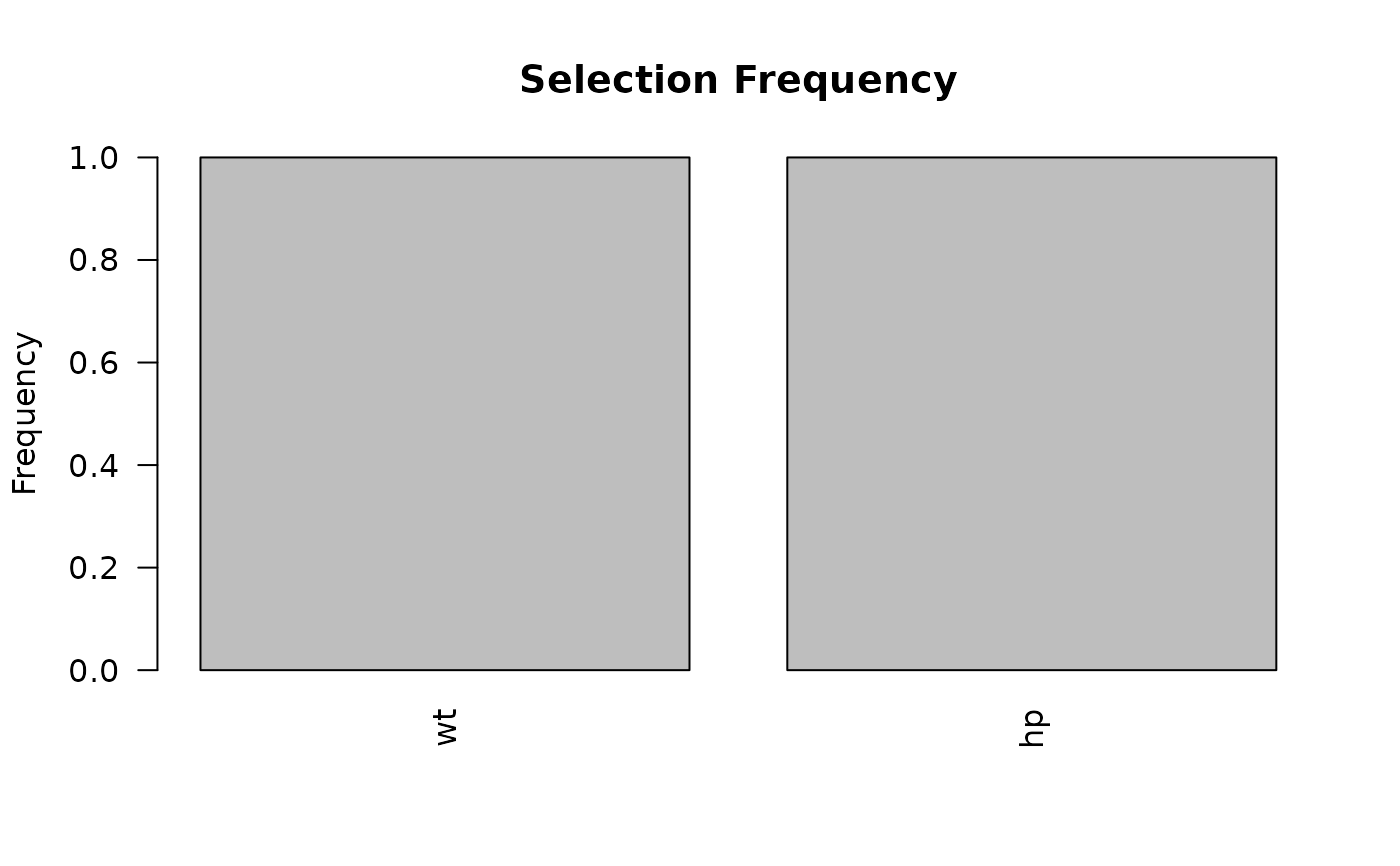
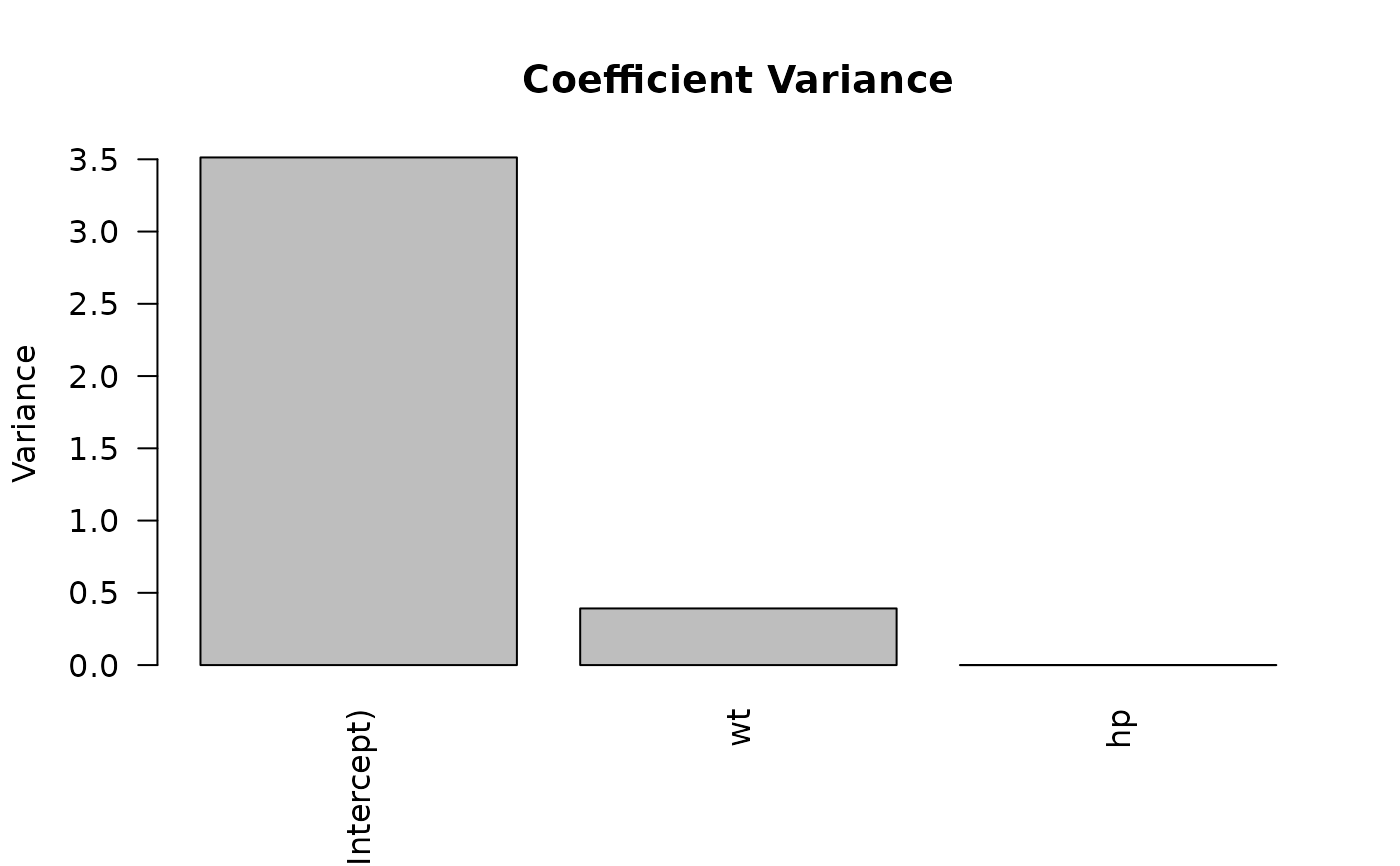
d <- run_diagnostics(mpg ~ wt + hp, data = mtcars, B = 50)
plot_stability(d, "coefficient")
 plot_stability(d, "selection")