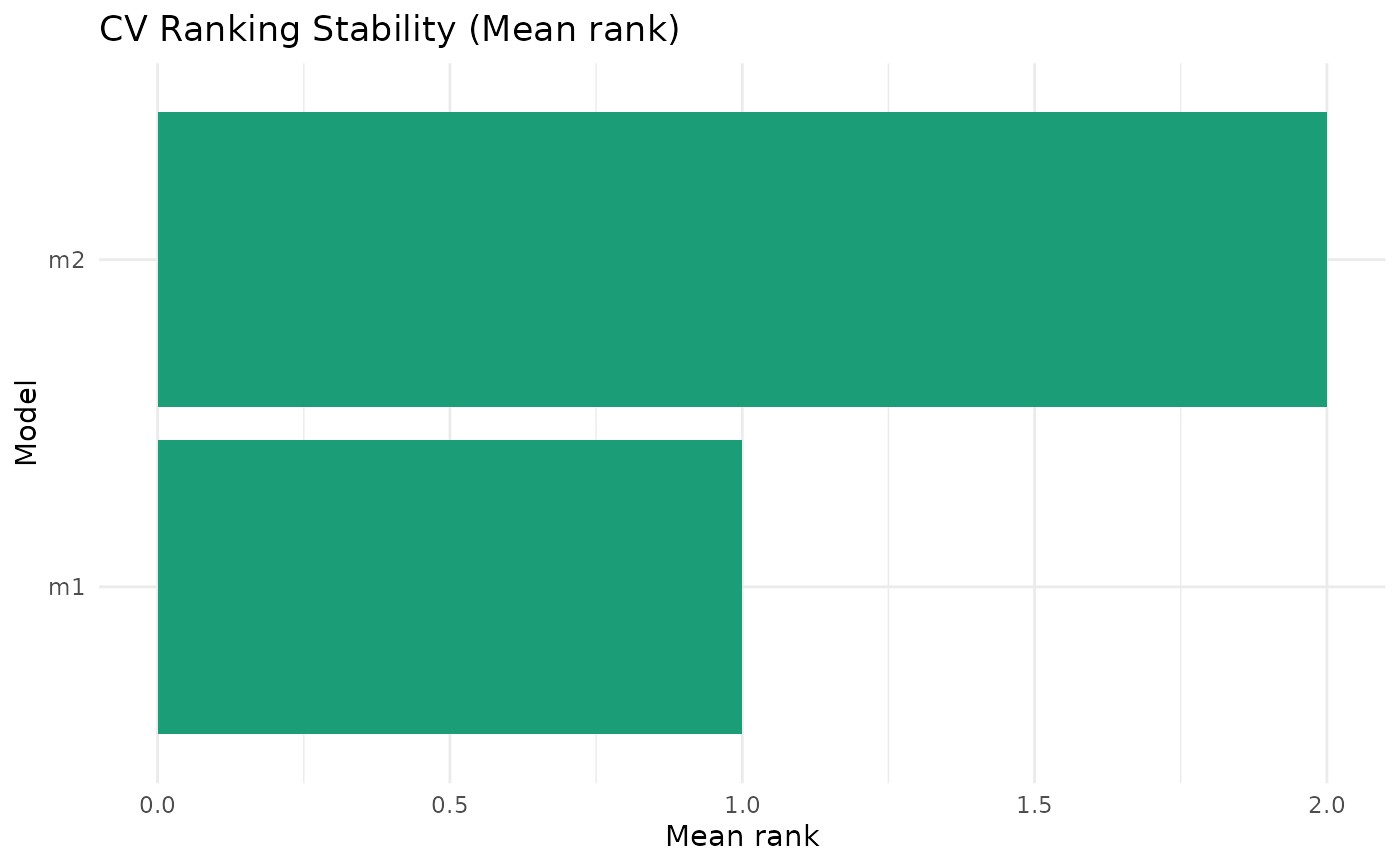
Produces a ggplot2 horizontal bar chart of either the top-1 frequency or the mean rank of each candidate model from a repeated cross-validation stability run.
Usage
plot_cv_stability_gg(cv_obj, metric = c("top1_frequency", "mean_rank"))Arguments
- cv_obj
A list returned by
cv_ranking_stability.- metric
One of
"top1_frequency"(default) or"mean_rank".
Examples
# \donttest{
if (requireNamespace("ggplot2", quietly = TRUE)) {
  models <- list(m1 = mpg ~ wt + hp, m2 = mpg ~ wt + hp + disp)
  cv <- cv_ranking_stability(models, mtcars, v = 5, R = 20)
  plot_cv_stability_gg(cv, "top1_frequency")
  plot_cv_stability_gg(cv, "mean_rank")
}

# }
# }