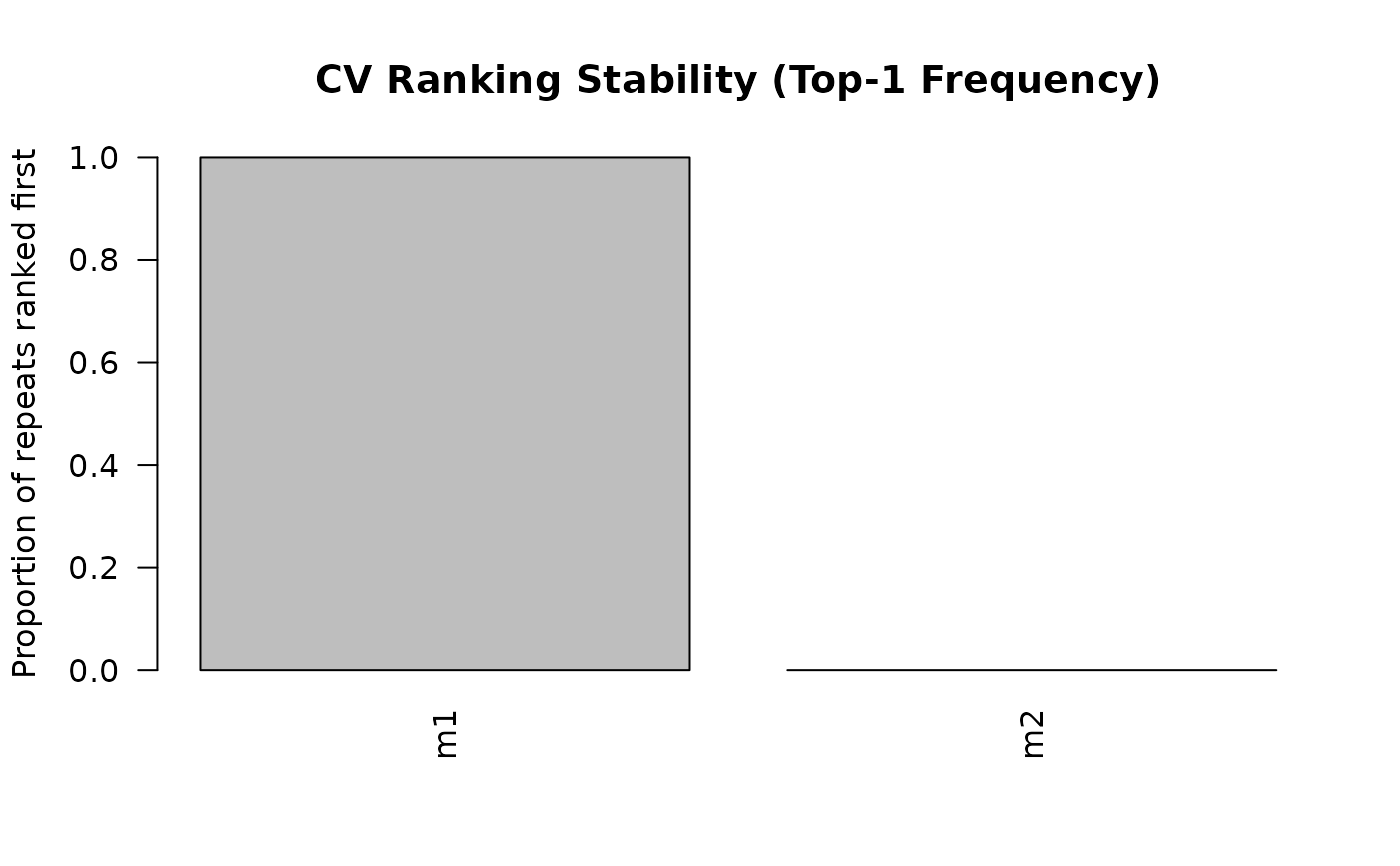
Produces a bar chart of either the top-1 selection frequency or the mean CV rank for each candidate model.
Usage
plot_cv_stability(cv_obj, metric = c("top1_frequency", "mean_rank"))Arguments
- cv_obj
A list returned by
cv_ranking_stability.- metric
Character string. One of
"top1_frequency"(default) or"mean_rank".
Examples
models <- list(m1 = mpg ~ wt + hp, m2 = mpg ~ wt + hp + disp)
cv_obj <- cv_ranking_stability(models, mtcars, v = 5, R = 20)
plot_cv_stability(cv_obj, metric = "top1_frequency")